Graphs without trend ( pie chart)
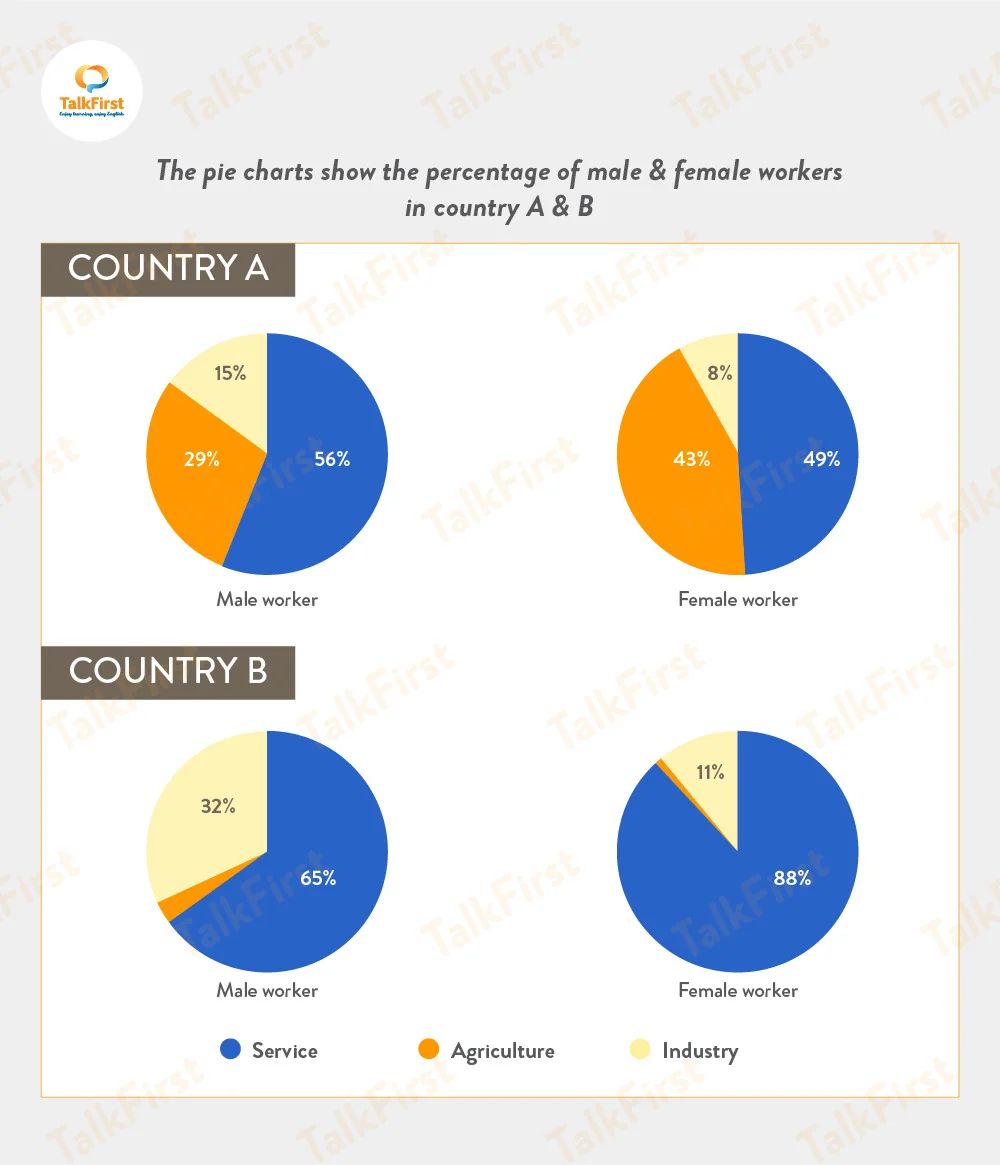
The graphs illustrate the employment of male and female in three fields including industry, agriculture, and services in country A and country B.
In general, the percentage of people working in services take the lion' s share in both nations, while industry makes up the lowest rate in country A. Also, the ratio of agriculture workers is seen at the bottom in country B.
According to the survey, in terms of man workers, there are large proportions of the employees working in the services sector, with 56% and 65% respectively. Regarding industry area, the figure for industrial workers in country A is double that for those workers in country B. Interestingly, the percentage of male workers involving in agriculture in country A is significant higher than that in country B by around 26%.
Turning to the distribution of woman labours, 88% of female employees work in services in country B compared to only 1% involving in agriculture and 11% for the rate of people in industry sector. In country A, fewer female work in services and industry at 40% and 8% correspondingly, whereas the figure for women in agriculture- related jobs is highest at 43%.
Bạn đang đọc truyện trên: TruyenTop.Vip